Financial Information
| S$M unless otherwise stated | FY22 | FY23 | FY24 | FY25 | FY26 |
| Operating revenue | 1,099 | 1,194 | 1,232 | 1,371 | 1,559 |
| Net revenue1 | 1,030 | 1,121 | 1,162 | 1,298 | 1,478 |
| EBITDA | 634 | 688 | 702 | 828 | 969 |
| EBITDA margin2 (%) | 62% | 61% | 60% | 64% | 66% |
| Operating profit | 537 | 590 | 606 | 743 | 887 |
| Operating profit margin2 (%) | 52% | 53% | 52% | 57% | 60% |
| Adjusted net profit attributable to equity holders of the company | 456 | 503 | 526 | 610 | 759 |
1
The presentation of revenue and expenses has been revised in FY2025 such that transaction-based expenses are netted-off against operating revenue to show net revenue. Net revenue for FY2022-FY2023 is calculated as operating revenue less processing and royalties, as a proxy.
2
EBITDA margin and operating profit margin are calculated on net revenue basis.
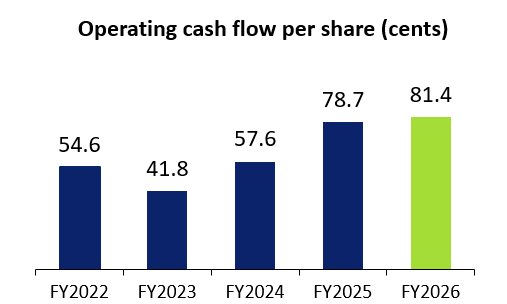
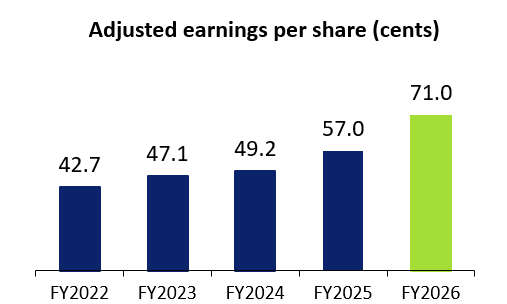
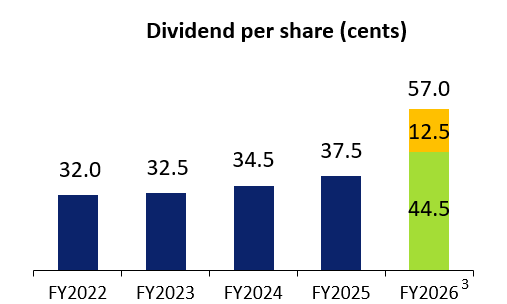
3
FY2026 total dividends include a one-time additional dividend of 12.5 cents per share
| FY22 | FY23 | FY24 | FY25 | FY26 | ||||
|---|---|---|---|---|---|---|---|---|
| Securities Clearing (Basis Points) | ||||||||
| Q1 | 2.57 | 2.58 | 2.49 (2.46)3 | 2.54 | 2.61 | |||
| Q2 | 2.64 | 2.48 | 2.46 (2.44) | 2.61 | 2.62 | |||
| Q3 | 2.54 | 2.44 | 2.47 (2.45) | 2.58 | 2.61 | |||
| Q4 | 2.49 | 2.47 | 2.52 (2.50) | 2.63 | 2.59 | |||
| Full Year | 2.56 | 2.49 | 2.49 (2.46) | 2.59 | 2.61 | |||
| Equity, Currency and Commodity Derivatives (SGD) | ||||||||
| Q1 | 1.45 | 1.62 [1.55] 2 | 1.53 (1.30) | 1.33 | 1.29 | |||
| Q2 | 1.56 | 1.55 [1.50] | 1.55 (1.32) | 1.27 | 1.26 | |||
| Q3 | 1.55 | 1.65 [1.59] | 1.54 (1.31) | 1.31 | 1.16 | |||
| Q4 | 1.49 | 1.62 [1.58] | 1.54 (1.32) | 1.24 | 1.12 | |||
| Full Year | 1.51 | 1.61 [1.56] | 1.54 (1.31) | 1.29 | 1.20 | |||
1
From FY2025, average fee per contract is reported net of transaction-based expenses, i.e. processing and royalties.
2
Figures in square brackets “[]” represent FY2023 pro-forma Equity, Currency and Commodity Derivatives average fee where Nifty royalties (licensing) expense is netted-off against Trading & Clearing revenues.
3
Figures in round bracket “()” represent FY2024 pro-forma average net fee where transaction-based expenses (processing and royalties) is netted-off against Trading & Clearing revenues.